Shape and Edit Data
End-users can sort, group, and filter data to easily locate records, navigate to the most important data or analyze trends. Conditional formatting and customizable cell value display add another degree of data readability.
Built-in Filter Row

Allows end-users to select text-based, numeric or date-time criterias and filter the dataset as their needs dictate.
Run Demo
Drag & Drop Data Grouping

Drag column headers to the panel above the grid to group data against multiple columns. Expand and collapse group rows to see the big picture or detailed data.
Run Demo
Integrated Data Editors

Integrate data editors into grid cells to facilitate end-user data input.
Run Demo
Layout and Presentation
Our Grid's capabilities go far beyond plain dataset visualization. Whether you require master-detail data presentation, hierarchical record display, or chart integration, the DevExpress React Grid is up to the challenge.
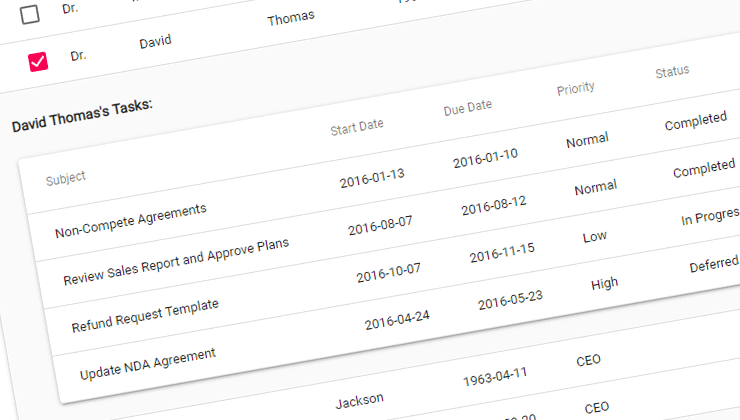
Master-Detail Display

See how you can enable master-detail data presentation within the DevExpress React Grid.
See Demo
Tree-List Metaphor

Easily visualize hierarchical data - enable the Tree/List display metaphor that allows end-users to expand/collapse child rows.
See Demo
Chart Control Integration

Easily integrate our React Chart Control into the Grid to enable effective data visualization.
See Demo