This example conditionally hides series labels of charts. Handle the ChartControl.CustomDrawSeriesPoint event and change the e.LabelText parameter's value.
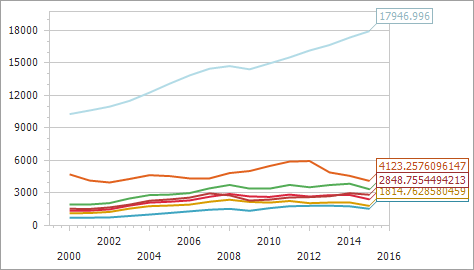
The example hides all point's labels except the last one:
Files to Review
Documentation
Does this example address your development requirements/objectives?


(you will be redirected to DevExpress.com to submit your response)
Example Code
Form1.cs(vb)
C#using System;
using System.Windows.Forms;
using DevExpress.XtraCharts;
using DevExpress.XtraCharts.Designer;
using System.Linq;

namespace ConditionallyHideSeriesLabels {
    public partial class Form1 : Form {
        public Form1() {
            InitializeComponent();
            // This line of code is generated by Data Source Configuration Wizard
            // Create a new DataSet
            System.Data.DataSet xmlDataSet = new System.Data.DataSet(@"XML DataSet");
            // Load the XML document to the DataSet
            xmlDataSet.ReadXml(@"Data\GDPofG7.xml");
            // This line of code is generated by Data Source Configuration Wizard
            chartControl1.DataSource = xmlDataSet.Tables[@"GDP"];

            chartControl1.SeriesTemplate.ArgumentDataMember = @"Year";
            chartControl1.SeriesTemplate.ValueDataMembers.AddRange(@"Product");

        }

        private void chartControl1_CustomDrawSeriesPoint(object sender, CustomDrawSeriesPointEventArgs e) {
            // Hide all point's labels except the last one.

            var test = e.Series.Points.Max(p => p.ArgumentX.NumericalArgument);

            if(!e.Series.Points.Max(p => p.ArgumentX.NumericalArgument).Equals(e.SeriesPoint.NumericalArgument)) {
                e.LabelText = "";
            }
        }
    }
}