Chart for WinForms - How to Exclude Weekends and Holidays from the Axis Range
This example demonstrates how you can exclude weekends and holidays from the X-axis range. This feature is useful for financial charting.
Files to Review
Example Overview
You can specify a custom week, or import holiday lists in Microsoft Outlook or in our native XtraScheduler format.
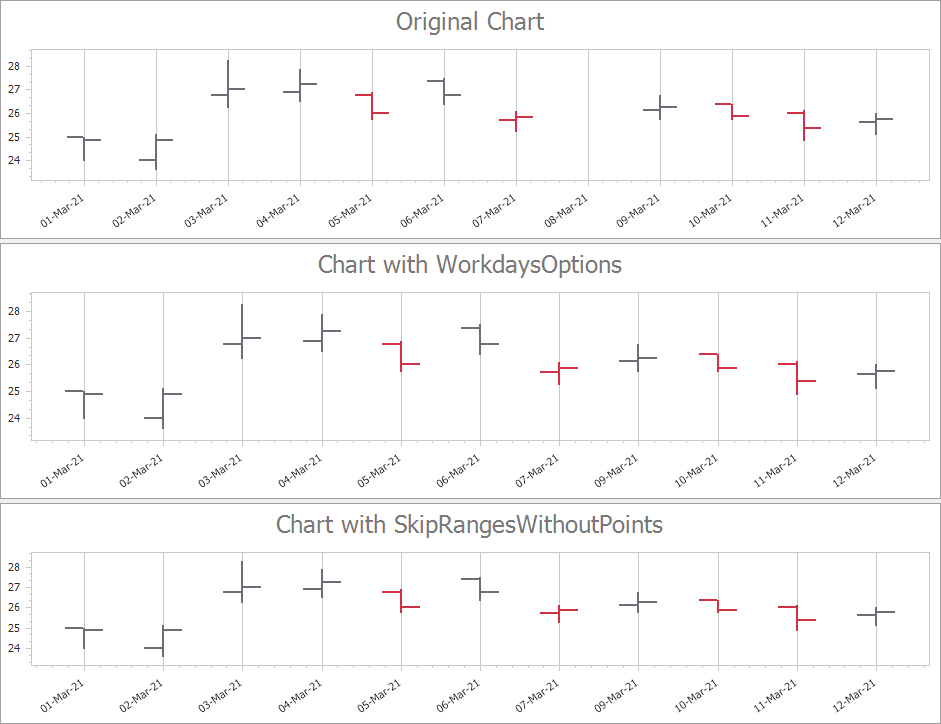
The first chart excludes holidays and non-working days from the axis scale and shows how to set custom workdays and holidays. In this example, Sunday is a work day and Saturday is a day off, March 6th (Saturday) is an additional work day and March 8th (Monday) is an additional holiday. For this, use the DateTimeScaleOptions.WorkdaysOnly and DateTimeScaleOptions.WorkdaysOptions properties.
The second chart shows how to exclude axis ranges without data points. In this example, March 8th has no data points to display and is not displayed on the X-axis. To do this, use the DateTimeScaleOptions.SkipRangesWithoutPoints property.
Documentation
Does this example address your development requirements/objectives?


(you will be redirected to DevExpress.com to submit your response)
This example demonstrates how you can exclude weekends and holidays from the X-axis range. This feature is useful for financial charting.
Files to Review
Example Overview
You can specify a custom week, or import holiday lists in Microsoft Outlook or in our native XtraScheduler format.
The first chart excludes holidays and non-working days from the axis scale and shows how to set custom workdays and holidays. In this example, Sunday is a work day and Saturday is a day off, March 6th (Saturday) is an additional work day and March 8th (Monday) is an additional holiday. For this, use the DateTimeScaleOptions.WorkdaysOnly and DateTimeScaleOptions.WorkdaysOptions properties.
The second chart shows how to exclude axis ranges without data points. In this example, March 8th has no data points to display and is not displayed on the X-axis. To do this, use the DateTimeScaleOptions.SkipRangesWithoutPoints property.
Documentation
Does this example address your development requirements/objectives?
(you will be redirected to DevExpress.com to submit your response)
Example Code
C#using DevExpress.XtraCharts;
using System;
using System.Data;
using System.Windows.Forms;

namespace WeekendsExclusion {
    public partial class Form1 : Form {
        public Form1() {
            InitializeComponent();
        }

        private void Form1_Load(object sender, EventArgs e) {
            #region OriginalChart
            Series series0 = chartControl0.Series[0];
            series0.ArgumentScaleType = ScaleType.DateTime;
            series0.DataSource = CreateChartData();
            series0.SetFinancialDataMembers("Argument", "Low", "High", "Open", "Close");
            #endregion

            #region Chart1
            Series series1 = chartControl1.Series[0];
            series1.ArgumentScaleType = ScaleType.DateTime;
            series1.DataSource = CreateChartData();
            series1.SetFinancialDataMembers("Argument", "Low", "High", "Open", "Close");

            DateTimeScaleOptions dateTimeScaleOptions = ((XYDiagram)chartControl1.Diagram).AxisX.DateTimeScaleOptions;

            // Enables workday options.
            dateTimeScaleOptions.WorkdaysOnly = true;

            // Specifies custom work days.
            // In this example, Sunday is a work day and Saturday is a day off.
            dateTimeScaleOptions.WorkdaysOptions.Workdays = Weekday.Sunday | Weekday.Monday | Weekday.Tuesday |
                Weekday.Wednesday | Weekday.Thursday | Weekday.Friday;

            // Specifies custom holidays.
            // In this example, March 8th (Monday) is an additional holiday.
            dateTimeScaleOptions.WorkdaysOptions.Holidays.Add(
                new KnownDate("Custom Holiday", new DateTime(2021, 3, 8, 0, 0, 0, 0)));

            // Specifies work days, which have priority over specified holidays.
            // In this example, March 6th (Saturday) is an additional work day.
            dateTimeScaleOptions.WorkdaysOptions.ExactWorkdays.Add(
                new KnownDate("Community Work Day", new DateTime(2021, 3, 6, 0, 0, 0, 0)));
            #endregion

            #region Chart2
            Series series2 = chartControl2.Series[0];
            series2.ArgumentScaleType = ScaleType.DateTime;
            series2.DataSource = CreateChartData();
            series2.SetFinancialDataMembers("Argument", "Low", "High", "Open", "Close");

            DateTimeScaleOptions dateTimeScaleOptions2 = ((XYDiagram)chartControl2.Diagram).AxisX.DateTimeScaleOptions;

            // Excludes all axis ranges without data points.
            // In this example, March 8th has no data points to display and is not displayed on the X-axis.
            dateTimeScaleOptions2.SkipRangesWithoutPoints = true;
            #endregion
        }

        private DataTable CreateChartData() {
            // Create an empty table.
            DataTable table = new DataTable("Table1");

            // Add two columns to the table.
            table.Columns.Add("Argument", typeof(DateTime));
            table.Columns.Add("Low", typeof(Double));
            table.Columns.Add("High", typeof(Double));
            table.Columns.Add("Open", typeof(Double));
            table.Columns.Add("Close", typeof(Double));

            table.Rows.Add(new DateTime(2021, 3, 1), 24.00, 25.00, 25.00, 24.875);
            table.Rows.Add(new DateTime(2021, 3, 2), 23.625, 25.125, 24.00, 24.875);
            table.Rows.Add(new DateTime(2021, 3, 3), 26.25, 28.25, 26.75, 27.00);
            table.Rows.Add(new DateTime(2021, 3, 4), 26.50, 27.875, 26.875, 27.25);
            table.Rows.Add(new DateTime(2021, 3, 5), 25.75, 26.875, 26.75, 26.00);
            table.Rows.Add(new DateTime(2021, 3, 6), 26.375, 27.50, 27.375, 26.75);
            table.Rows.Add(new DateTime(2021, 3, 7), 25.25, 26.1, 25.725, 25.85);
            table.Rows.Add(new DateTime(2021, 3, 9), 25.75, 26.75, 26.125, 26.25);
            table.Rows.Add(new DateTime(2021, 3, 10), 25.75, 26.375, 26.375, 25.875);
            table.Rows.Add(new DateTime(2021, 3, 11), 24.875, 26.125, 26.00, 25.375);
            table.Rows.Add(new DateTime(2021, 3, 12), 25.125, 26.00, 25.625, 25.75);

            return table;
        }
    }
}