This example shows how to create a Candlestick chart and bind it to data at runtime.
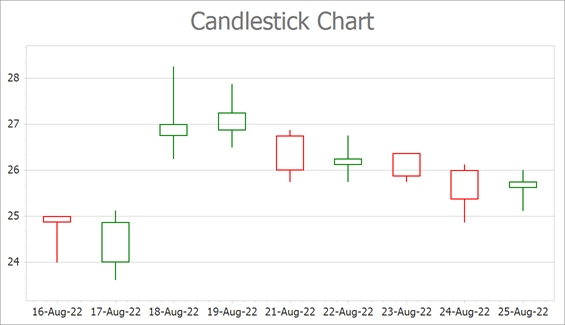
In this example, you add a Series object of the CandleStick view to the ChartControl.Series collection. To specify the data source of the series, use the DataSource property. Call the SeriesBase.SetFinancialDataMembers method to define which data members store arguments, and Open, High, Low, and Close values.
Cast the View property of the series to the CandleStickSeriesView type to access bar series appearance settings.
The Chart Control uses the XY-Diagram to display candlestick series. Cast the ChartControl.Diagram property to the XYDiagram type to access diagram settings. The Chart Control determines the diagram type based on the series that is added first. We recommend that you access the diagram to configure its settings after at least one series is added to the chart.
Files to Look At
Documentation
More Examples
- How to create a Stock chart
- How to display a regression line for a series
- How to draw Fibonacci Arcs, Fans and Retracement for a Stock series
Does this example address your development requirements/objectives?


(you will be redirected to DevExpress.com to submit your response)
Example Code
C#using System;
using System.Collections.Generic;
using System.Drawing;
using System.Windows.Forms;
using DevExpress.XtraCharts;

namespace CandleStickChart {
    public partial class Form1 : Form {
        public Form1() {
            InitializeComponent();
        }

        private void Form1_Load(object sender, EventArgs e) {
            // Create a new chart.
            ChartControl candlestickChart = new ChartControl();

            // Create a candlestick series.
            Series series1 = new Series("Series 1", ViewType.CandleStick);

            // Bind the series to data.
            series1.DataSource = GetDataPoints();
            series1.SetFinancialDataMembers("Argument", "Low", "High", "Open", "Close");

            // Specify that date-time arguments are expected.
            series1.ArgumentScaleType = ScaleType.DateTime;

            // Add the series to the chart.
            candlestickChart.Series.Add(series1);

            // Customize the series view settings.
            CandleStickSeriesView view = (CandleStickSeriesView)series1.View;

            view.LineThickness = 2;
            view.LevelLineLength = 0.25;

            // Specify the series reduction options.
            view.ReductionOptions.ColorMode = ReductionColorMode.OpenToCloseValue;
            view.ReductionOptions.FillMode = CandleStickFillMode.AlwaysEmpty;
            view.ReductionOptions.Level = StockLevel.Close;
            view.ReductionOptions.Visible = true;

            // Set point colors.
            view.Color = Color.Green;
            view.ReductionOptions.Color = Color.Red;

            // Access the chart's diagram.
            XYDiagram diagram = (XYDiagram)candlestickChart.Diagram;

            // Exclude empty ranges from the X-axis range
            // to avoid gaps in the chart's data.
            diagram.AxisX.DateTimeScaleOptions.SkipRangesWithoutPoints = true;

            // Hide the range without points at the beginning of the y-axis.
            diagram.AxisY.WholeRange.AlwaysShowZeroLevel = false;

            // Hide the legend.
            candlestickChart.Legend.Visibility = DevExpress.Utils.DefaultBoolean.False;

            // Add a title to the chart.
            candlestickChart.Titles.Add(new ChartTitle());
            candlestickChart.Titles[0].Text = "Candlestick Chart";

            // Add the chart to the form.
            candlestickChart.Dock = DockStyle.Fill;
            this.Controls.Add(candlestickChart);
        }

        List<DataPoint> GetDataPoints() {
            List<DataPoint> dataPoints = new List<DataPoint> {
            new DataPoint(DateTime.Now.AddDays(-9), 24.00, 25.00, 25.00, 24.875),
            new DataPoint(DateTime.Now.AddDays(-8), 23.625, 25.125, 24.00, 24.875),
            new DataPoint(DateTime.Now.AddDays(-7), 26.25, 28.25, 26.75, 27.00),
            new DataPoint(DateTime.Now.AddDays(-6), 26.50, 27.875, 26.875, 27.25),

            new DataPoint(DateTime.Now.AddDays(-4), 25.75, 26.875, 26.75, 26.00),
            new DataPoint(DateTime.Now.AddDays(-3), 25.75, 26.75, 26.125, 26.25),
            new DataPoint(DateTime.Now.AddDays(-2), 25.75, 26.375, 26.375, 25.875),
            new DataPoint(DateTime.Now.AddDays(-1), 24.875, 26.125, 26.00, 25.375),
            new DataPoint(DateTime.Now.AddDays(0), 25.125, 26.00, 25.625, 25.75),
            };
            return dataPoints;
        }
    }
    public class DataPoint {
        public DateTime Argument { get; set; }
        public double Low { get; set; }
        public double High { get; set; }
        public double Open { get; set; }
        public double Close { get; set; }
        public DataPoint(DateTime argument, double low, double high, double open, double close) {
            this.Argument = argument;
            this.Low = low;
            this.High = high;
            this.Open = open;
            this.Close = close;
        }
    }
}